EVV Compliance Report
To enhance transparency and accountability within the EVV compliance process, payers, providers, and the state has access to the EVV Compliance Report. As each state sets EVV thresholds, this report aims to provide a monthly snapshot of EVV compliance.
This report is state specific and not all states have identical columns of information.

- Providers receive a report displaying their EVV compliance percentage by contract or payer for the year to date (YTD).
- Payers receive a report displaying the EVV compliance percentage for each provider in their network.
- The State receives a comprehensive report summarizing all providers' EVV compliance percentages.
The EVV Compliance Report offers providers and payers with the same EVV compliance data, delivered on the same date each month. With this information, providers can understand the compliance percentage payers have recorded for them, giving insight into their performance.
For payers, this report serves as a monthly benchmark to measure the compliance of their provider network. Payers can also use the EVV dashboard in the Payer Portal to drill down into each provider’s data, allowing for more detailed analysis and follow-up actions to improve compliance.
Providers can review the report each month, compare their compliance numbers with the payers’ numbers, and take corrective action if necessary to improve performance.
This information introduces you to the State & Health Plan EVV Compliance Report.
How to Export Your Data - Your Process at a Glance
-
Navigate to Reports > State & Health Plan EVV Compliance Report.
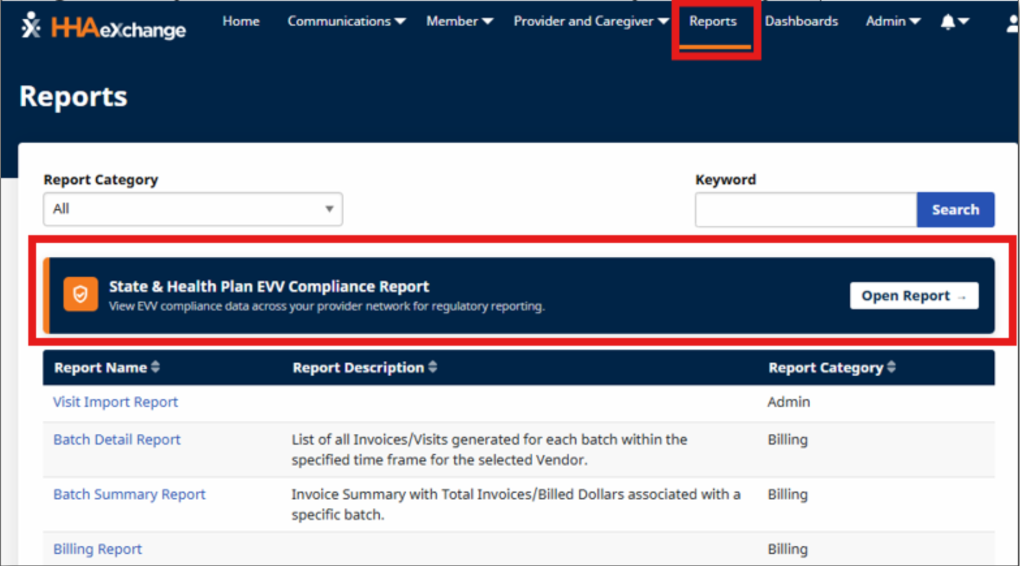
-
Confirm the correct reporting window is set. The report automatically displays the current reporting period — no changes are needed.

-
Click "Export to NYSDOH Excel".
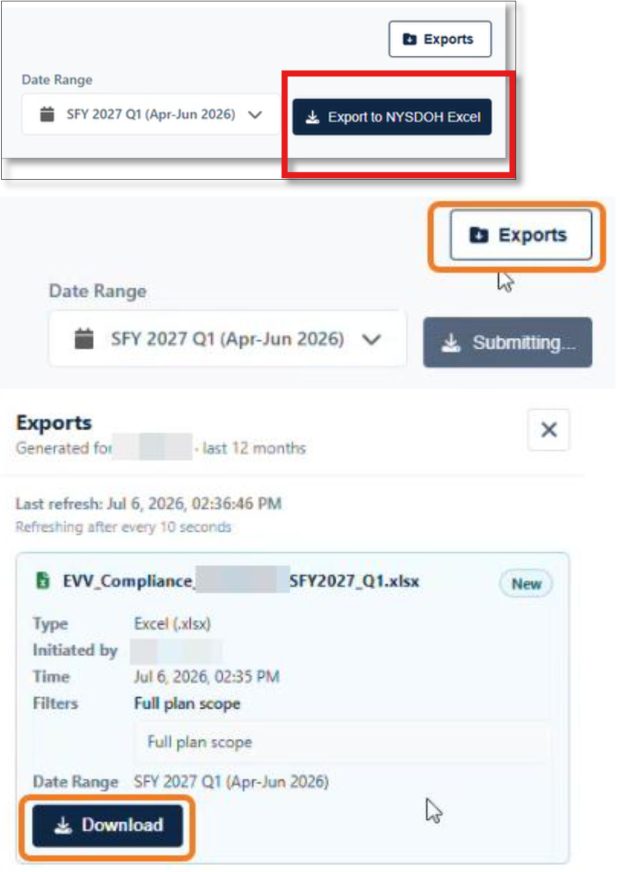
-
Once you open the Excel, review the tabs in the document. Complete the experiential questions found on the excel export.
-
Fill out the attestation form on the excel export.
-
After completing your review and making the necessary entries to the excel sheets in Steps 4 & 5, submit the report as directed by the New York State Department of Health (NYSDOH).
Report Dashboard Overview
The screenshot below shows your data report dashboard. The following sections explain the main data points on your dashboard — what the numbers mean and how they are calculated.
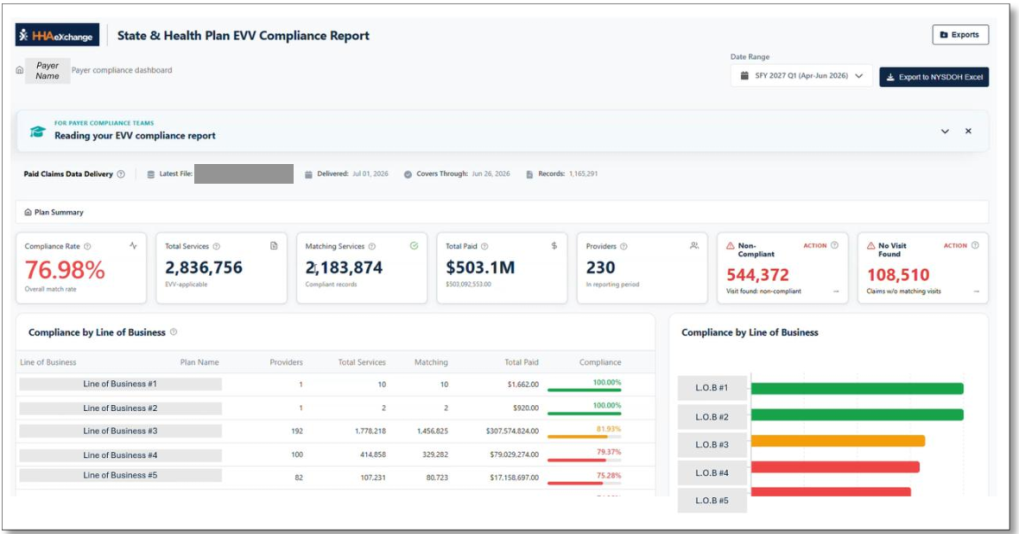
Section 1 - Date Range

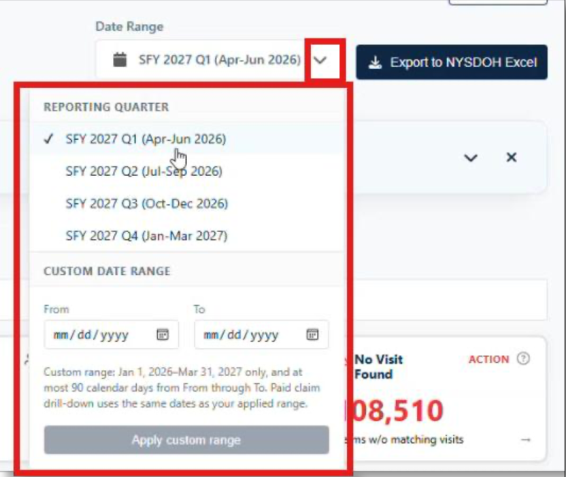
The date range on your dashboard is automatically set to the current reporting period. You do not need to modify it to pull your data.
You may use the drop-down menu (shown below) to navigate different reporting periods if you want to view data outside of your current period.
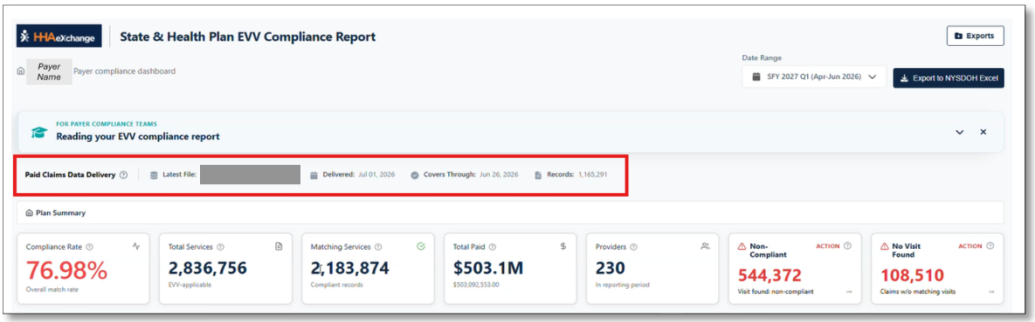
Section 2 - Paid Claims Data Delivery
This area shows the most recent paid claims file submitted to HHAeXchange — the file from which the current data set is being calculated.
Payers must submit paid claims data to HHAeXchange on a monthly basis to ensure this report reflects accurate data. Failure to do so will result in inaccurate reporting.
Section 3 - Your Plan Summary
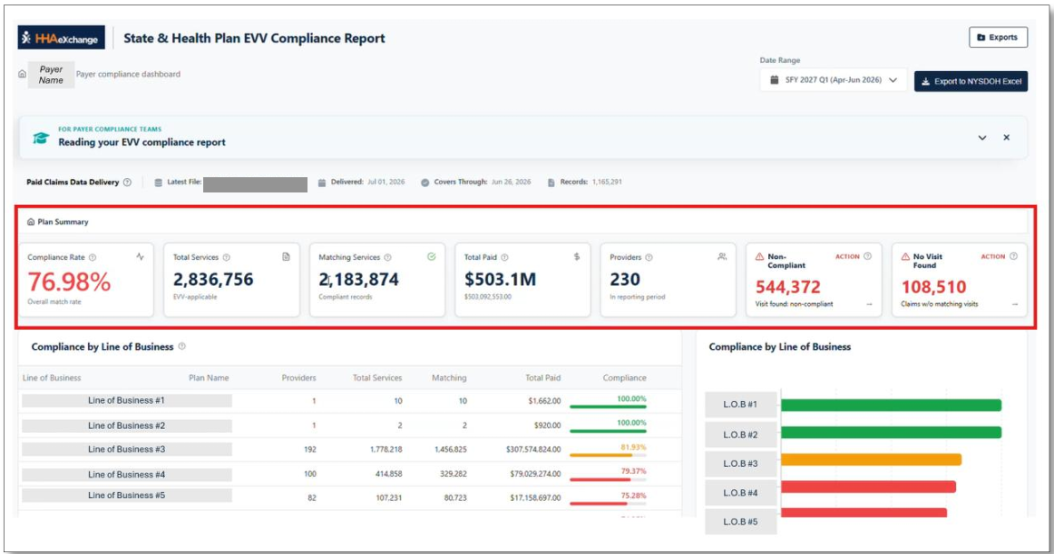
The following table explains the most relevant data points in your Plan Summary.
| Data Point |
What It Means |
|---|---|
| Compliance Rate | The portion of total paid claim services that were matched to fully compliant EVV records. |
| Total Services | All EVV-applicable services submitted for the selected time range. |
| Matching Services | Services that were successfully matched to compliant EVV records - in other words, paid claims with fully validated EVV records. |
| Total Paid | The total dollar value of the Total Services included in the reporting periods displayed in the report. |
| Providers | The number of unique providers included in the reporting period. |
| Non-Compliant | The difference between Total Services and Matching Services. These are paid claims where EVV records were found but do not meet compliance requirements. |
| No Visit Found | Paid claims for which no associated EVV visit has been found. |
How These Numbers are Calculated
Compliance Rate = Matching Services / Total Services x 100
Total Services = Matching Services + Non-Compliant + No Visit Found
Click into the Non-Compliant or No Visit Found fields to review detailed information about the records that are affecting the compliance score. You can add filters to explore specific data sets and identify where action is needed.
You do not need to modify any columns to generate your DOH report — the export is pre-configured. Column options are provided to help you investigate and take action on your data.
Section 4 - Compliance by Line of Business
Use this section to review compliance across each line of business. The color coding indicates each line's standing relative to the compliance threshold.
Green: Compliance Score of 90 and above
Orange: Compliance Score of 80-89Red: Compliance Score of 79 and Below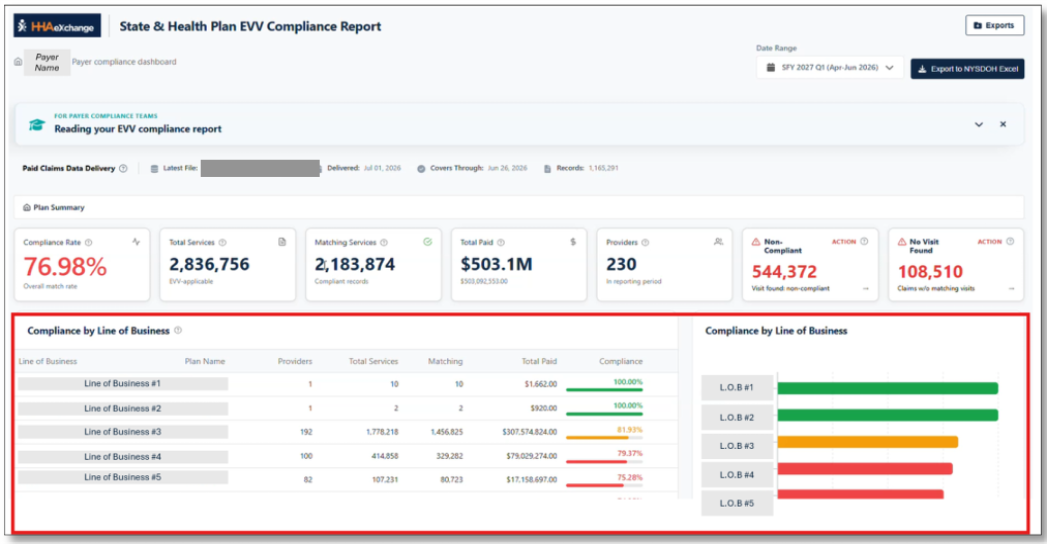
Key Take Aways
The State & Health Plan EVV Compliance Report is more than a monthly reporting requirement—it is a tool for identifying trends and focusing improvement efforts. Reviewing this report regularly helps you understand where compliance challenges exist and prioritize outreach with providers.
Need Help?
For support and questions about the report please contact Customer Success.
Download the State & Health Plan EVV Compliance Report instructions.
There are several exception reports that can be used to identify and address discrepancies or irregularities in visit data. They highlight issues such as missing Clock-Ins/Clock-Outs, mismatches in scheduled vs. actual visit times, or EVV compliance problems.
These reports can:
- Identify areas of non-compliance.
- Correct missing or incorrect visit data.
- Improve overall operational efficiency and compliance by addressing the flagged exceptions.
Refer to the Exception Reports Definitions topic for more information.